Custom
If you have complex query or authentication requirements, you may prefer to deploy your own query engine to benefit from your existing authentication or custom query functionality. For this, you will transform Vizzly queries into Vizzly results.
Vizzly queries and results
To integrate your custom query engine with Vizzly, we require you to implement the async runQueries function.
We will call the runQueries with an array of Vizzly formatted queries and an abort signal (opens in a new tab), and expect either an
array of Vizzly formatted results, or null indicating something went wrong.
Learn more about the query format here, and the result format here.
Example
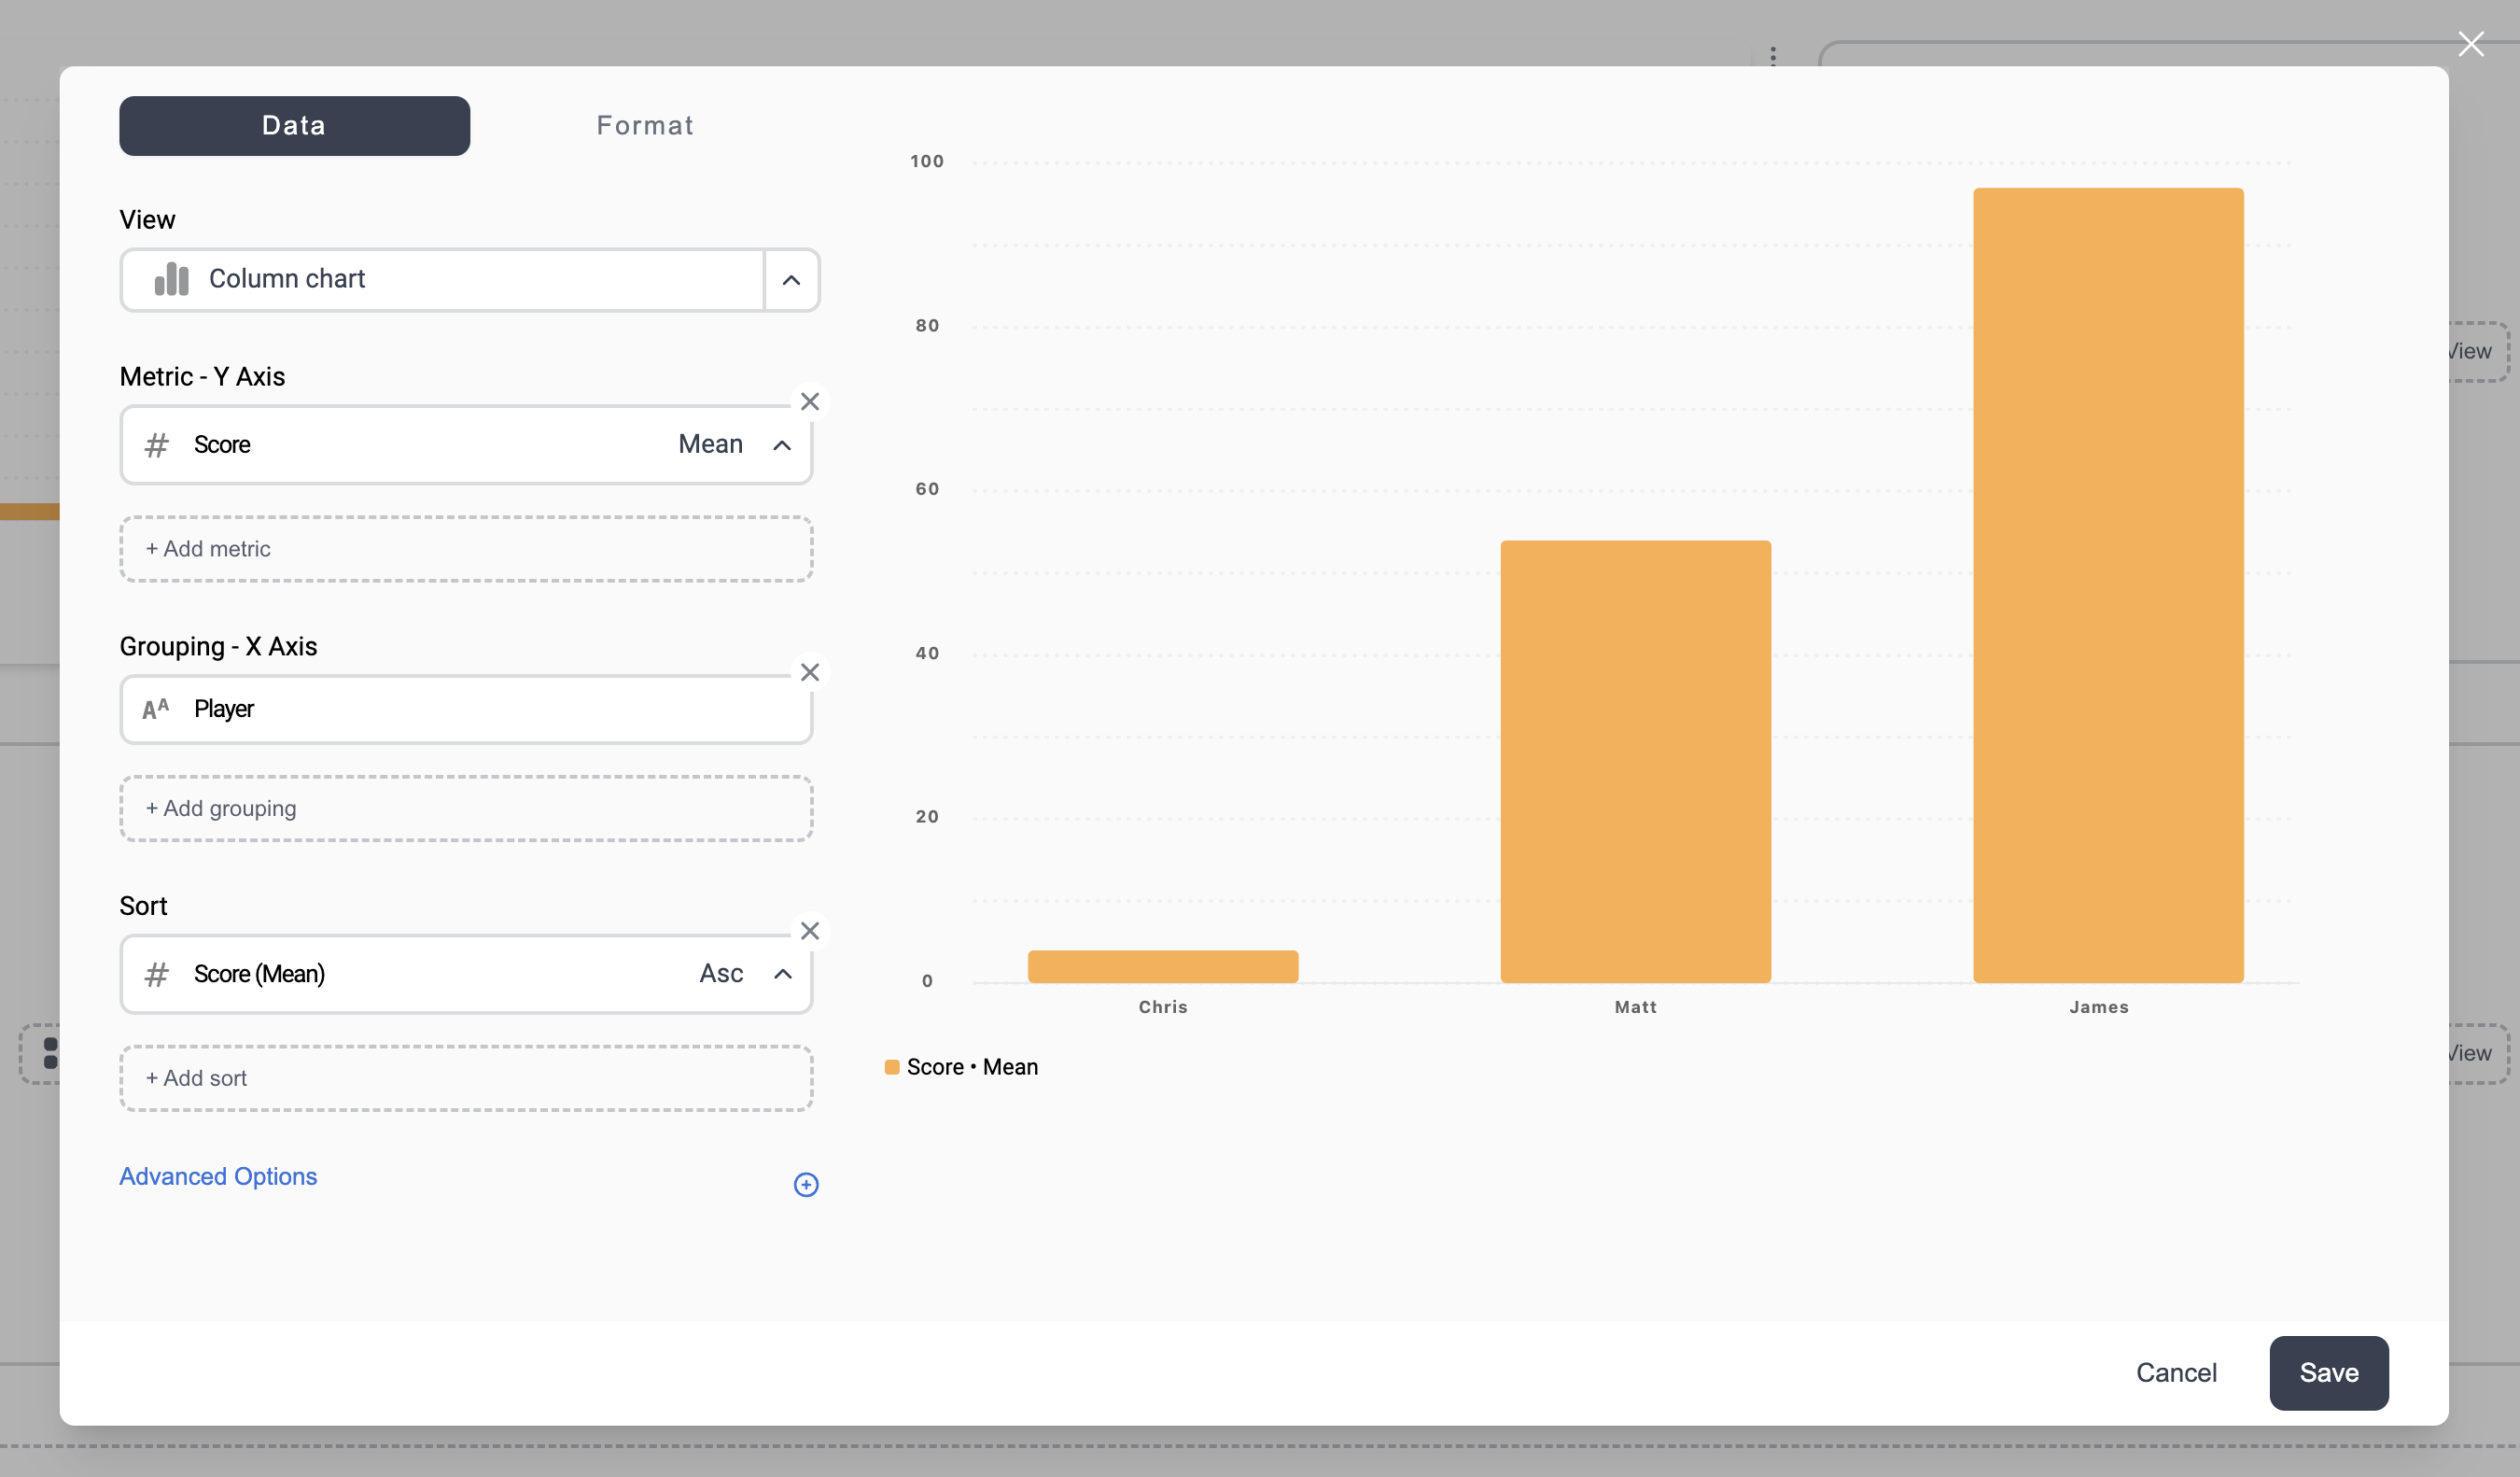
In this example, we are going to render a chart using a custom query engine that compares the average score of 3 players playing an arcade game.
Query
This is the list of queries that your query engine will need to convert into a result.
Learn more about the query format here.
[
  {
    "type": "query",
    "dataSetId": "das_1",
    "measure": [
      {
        // The type of this measure
        "type": "field",
        // The ID of the field to return. Notice how in the "group" value, we
        // are instructing the query to group by this field.
        "value": "player_field_id",
        // "none" because there is no transformation function to apply.
        "function": "none"
      },
      {
        // The type of this measure
        "type": "field",
        // Identify the field
        "value": "score_field_id",
        // "mean" because we want to show the average score
        "function": "mean"
      }
    ],
    "group": [
      // Instruct the query to group by the first field (position 0) in the measure list.
      { "index": 0 }
    ],
    "filter": [
      // There are no filters for this example.
      []
    ],
    "order": [
      // Order results by measure at position 1, in an ascending order.
      {
        "index": 1,
        "direction": "asc"
      }
    ],
    // Set a limit to the number of results to return.
    "limit": 5000
  }
]
Result
Now that your custom query engine has processed the results, it will return the result in this format;
Learn more about the result format here.
[
  ['Chris', 4],
  ['Matt', 54],
  ['James', 97]
]
Rendered chart
Once the result has been returned from the runQueries call, the Vizzly dashboard takes over and renders the chart on the dashboard.
